
Content creators put so much effort into preparing, creating, and marketing their work, but then what? What happens when a video underperforms and you aren’t sure why? Or when something goes viral but you find yourself similarly confounded? YouTube has spent years refining the data it collects for creators to help scrutinize video performance and strategize the best ways to keep putting out killer content and growing their channel, so let’s talk about how to use YouTube analytics.
What is YouTube Analytics?
YouTube Analytics is a tool provided by YouTube that offers content creators essential insights into their video performance and audience behavior. It functions as a data hub, tracking metrics such as view count, watch time, and audience demographics, to not only help creators understand how videos are performing but also to help leverage that information and make informed decisions about future content strategies.
What are the benefits of YouTube analytics?
Some information about YouTube videos and channels is public for everyone to see, including view counts, comments, and subscribers. But that’s only the tip of the iceberg when it comes to the amount of data that’s available for creators to dive into behind the scenes.
We’ll talk more about the benefits of tracking specific metrics as we get further along, but part of the goal of YouTube’s analytics as a whole is to provide creators with enough information that you can then use to identify patterns. This can include how new viewers are finding content, at what point they click out of a video, and so much more.
Keeping tabs on this data over time can be highly valuable for creators looking to grow their channels, particularly when testing out new topics, formats, or methods for drawing in viewers.
How do I access my YouTube analytics?
YouTube analytics are available to all creators who upload content to the platform—not just members of the YouTube Partner Program.
To access this information, navigate to YouTube Studio while signed into the correct account, then click on the Analytics icon on the left-hand sidebar.
Once there, you’ll see four tabs:
- Overview: This provides a quick look at how your channel is performing as a whole.
- Content: This is where you can find more insight into how your videos are performing.
- Audience: This section offers deeper insight into the makeup and behaviors of your audience and subscribers.
- Research: This tab allows you to search topics and find out what the top video results are and how popular they are with your audience. This is here to help you brainstorm future video ideas for your channel.
What analytics are available on YouTube?
The best way to get to know your analytics is to dive in and take a look for yourself on your channel. But if you’re planning ahead prior to releasing content, hoping to get further insight on how to best use these metrics to your advantage, or need help understanding what something means, we’re here to walk you through everything.
YouTube analytics can essentially be broken down into three categories: your channel, your content, and your audience, although all three play into one another and there is overlap when looking at the data.
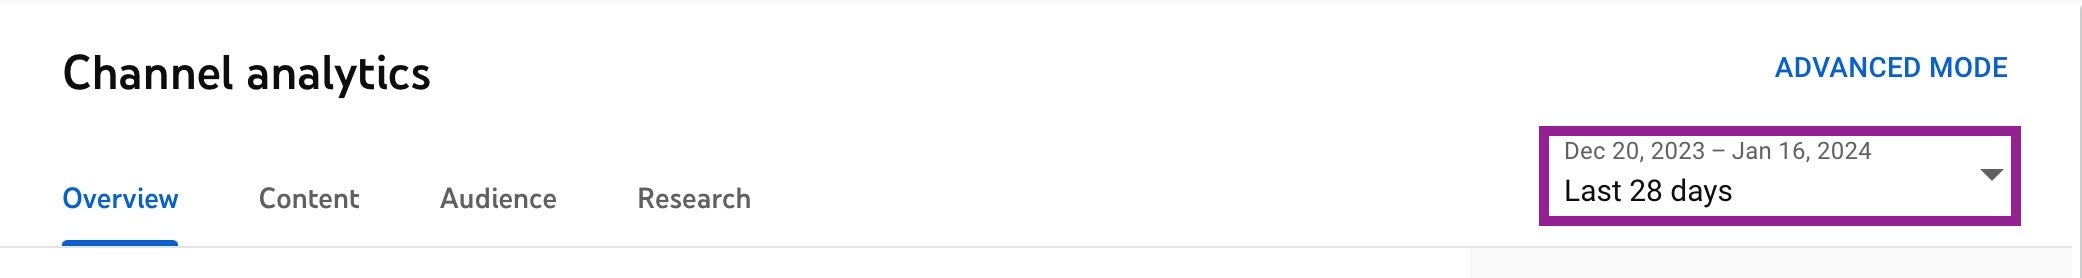
Before we explain the metrics available to you, one important thing to note is that all analytics will reflect the last 28 days of data by default, and this is what we will be referencing when explaining the metrics unless otherwise specified. If you would like to change the amount of time covered or the specific dates under review, you can do so by clicking on the drop-down arrow next to “Last 28 days” in the right-hand corner of your Channel Analytics page.
YouTube channel analytics
Think of your channel analytics as a bird’s eye view of how your cumulative work is performing. Looking at this data is more about getting a temperature check for any positive or negative overall trends in your channel’s performance before narrowing what you’re looking at down to determine how individual pieces of content are performing.
To do this, you’ll be best served by visiting the Overview tab.
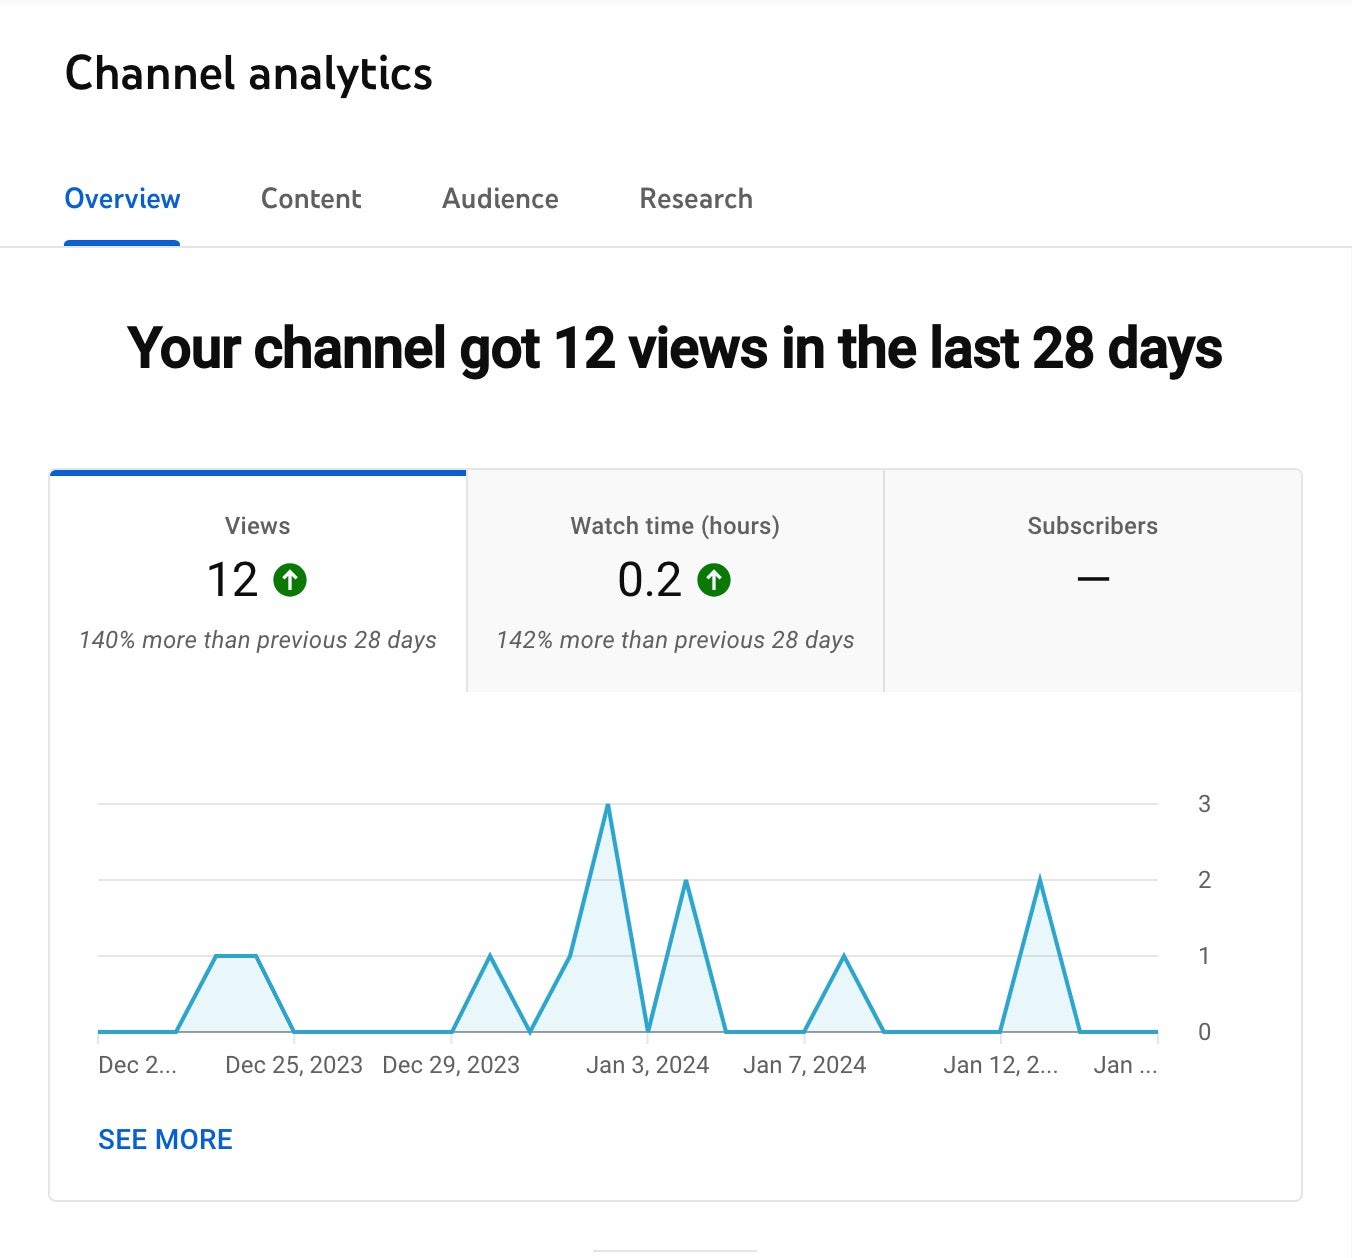
Here, you’ll find the following information:
Views: The number of times your videos have been watched, and the percentage change from the previous 28 days.
Watch time (hours): The number of hours viewers have spent watching all of your videos combined, and the percentage change from the previous 28 days.
Subscribers: The number of users who have subscribed to your channel during this period, and the percentage change from the previous 28 days.
Your top content in this period: The videos on your channel that performed the best.
Realtime: This section offers live updates on the current performance of your channel, including subscriber count, views, and top content. You can also click “See More” here to look at data specific to the past 48 hours and the past 60 minutes.
Check out: Maximizing YouTube Payouts: A Step-by-Step Guide for Creators
YouTube video analytics
You can analyze the data relating to your videos by looking at all your content as a whole, breaking them down into long-form videos vs. YouTube Shorts, or getting specific information about individual videos.
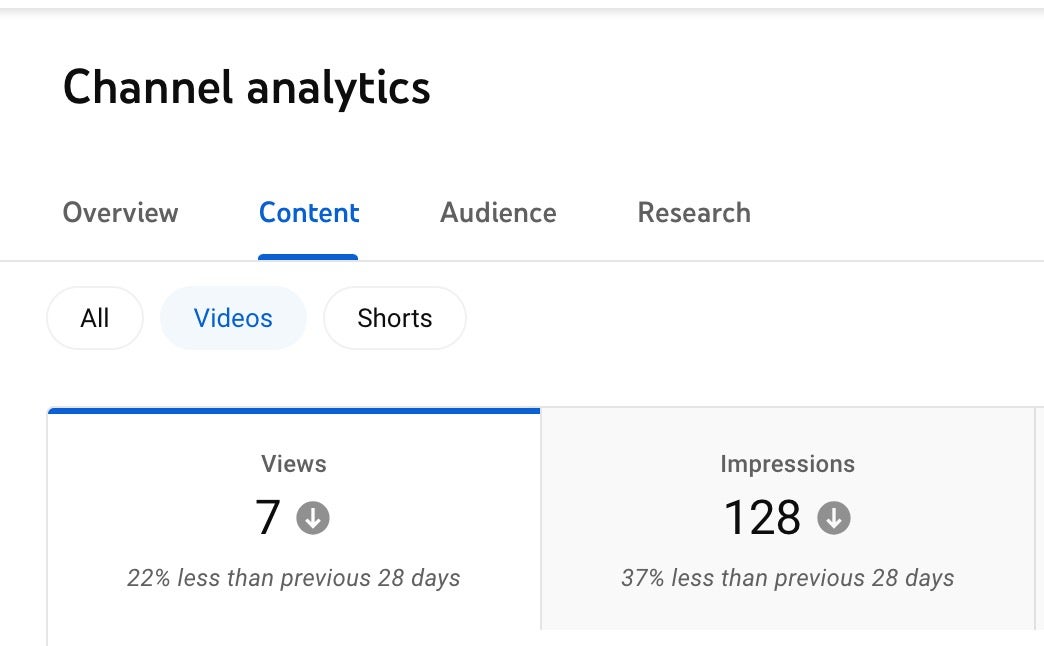
The first two options can be found under the Content tab, which allows you to switch between information on your longer-form videos, YouTube Shorts, and “All.”
To access metrics for specific content, you can click on the video anywhere it shows up in the Analytics section, find it on the Channel content page in YouTube Studio, or click “Analytics” from the actual video page, assuming you’re signed in. There, you’ll find four tabs: Overview, Reach, Engagement, and Audience.
Some of the metrics you’ll be able to access for your videos include:
- Views
- Impressions: How often your video thumbnails are displayed to users on YouTube.
- Impressions click-through rate: The percentage of users who clicked on your video after seeing the thumbnail.
- Average view duration: How long viewers spent watching the specified video, on average.
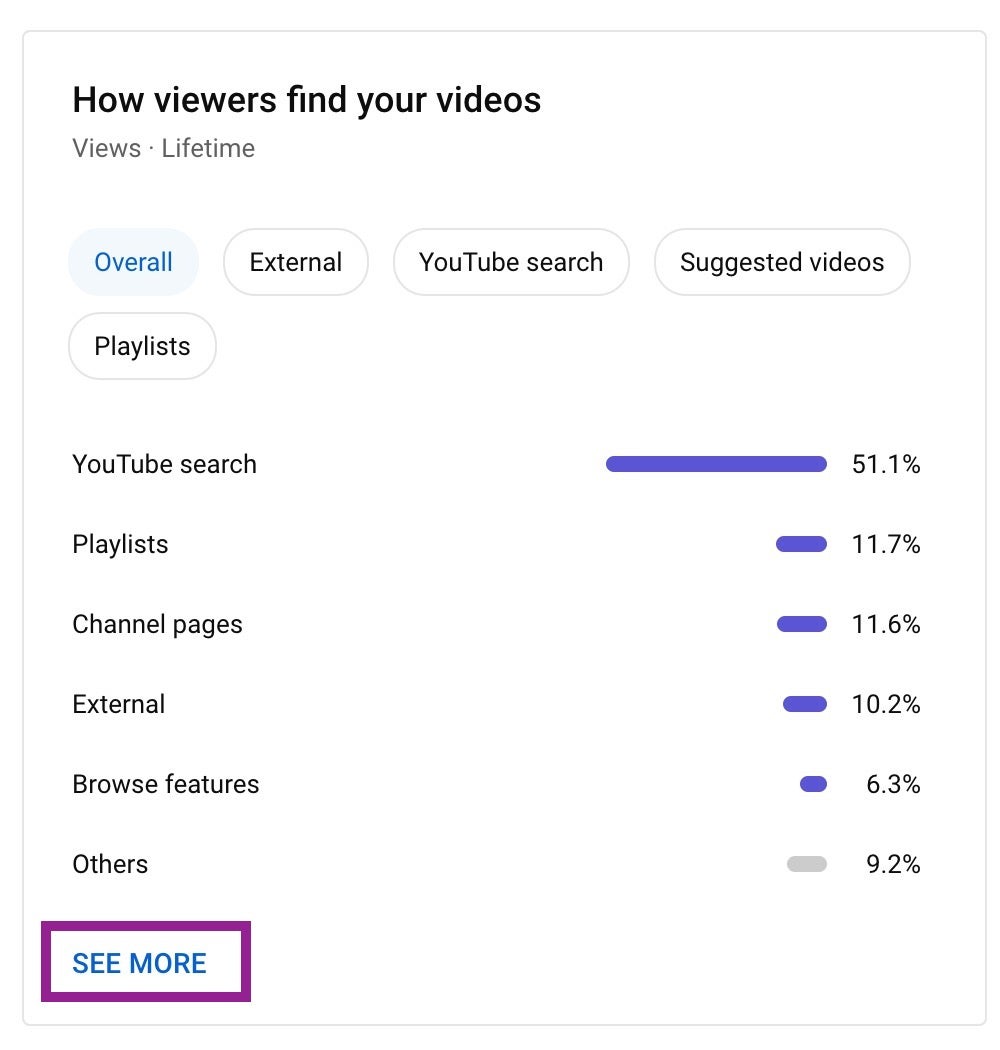
- How viewers find your videos: This breaks down the traffic sources that lead people to your videos, including YouTube searches, suggested videos, playlists, and more.
- Subscribers
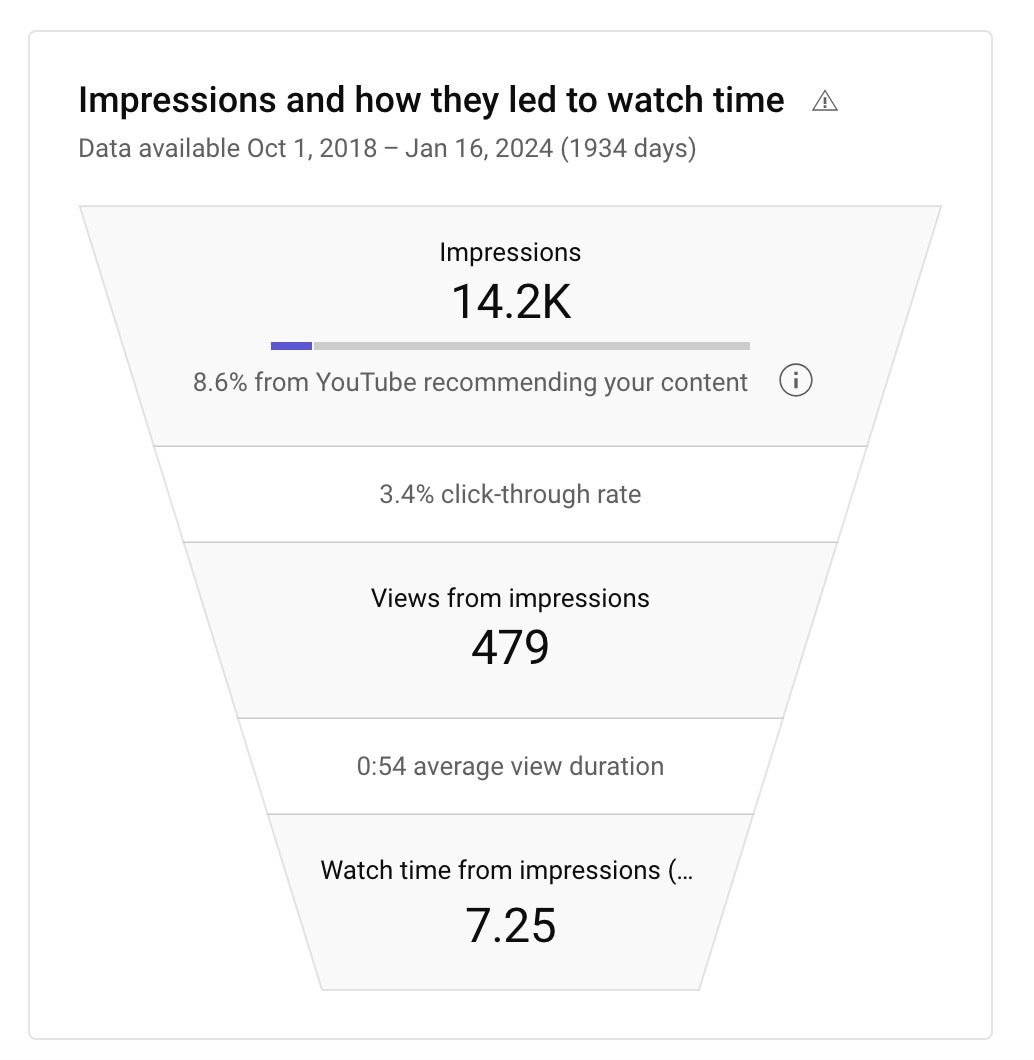
- Impressions and how they led to watch time: This tells you how many impressions your content had as well as what percentage came from YouTube recommending it to people vs people specifically seeking out your content. It then goes several steps further, telling you how many impressions turned into views and how much watch time that created.
- Shown in feed: How many times your Short was displayed in users’ subscription feeds.
- How many chose to view: The number of users who decided to watch your video after it was presented to them.
- Top videos/Shorts: The most popular videos/Shorts on your channel.
- Top Remixed: Shorts that incorporate elements of your content.
When you dig into data on specific videos, even more information becomes available, such as:
- Watch time (hours)
- Average percentage viewed: The average portion of your video that viewers watch.
- Unique views: The number of distinct users who have watched your videos.
- Content suggesting this video: Where viewers found your video, such as through recommendations or related content.
- Playlists featuring this video: The number of playlists that include your video.
- YouTube search terms: Terms viewers used to find your video, and the percentages that used each.
- Likes (vs. Dislikes): The positive and negative feedback on your videos, in the form of Likes.
- End screen element click rate: The percentage of viewers who clicked on elements in the end screen.
Check out: Growing Your YouTube Channel’s Subscribers and Views—a Guide
YouTube audience analytics
The Audience tab is where you find information about your actual viewers. Now, you can’t see info on individual users, but you can see numbers and percentages to get a better idea of the makeup of folks watching your channel. As with your YouTube video analytics, you can look up much of this information both for your channel as a whole and on individual videos.
Returning viewers: Viewers who previously watched your channel and have returned to watch content from you again.
Unique viewers: The number of distinct users who watched your videos.
Watch time from subscribers: The percentage of watch time that comes from your subscribers vs viewers who are not subscribed to your channel.
When your viewers are on YouTube: The times of day or days of the week when your audience is most active on YouTube.
Channels your audience watches: The YouTube channels that your viewers also watch.
Age and gender: The age groups and genders of your audience.
What your audience watches: Videos from other channels that your viewers also watch.
Formats your viewers watch on YouTube: Whether your viewers are watching videos, Shorts, or live-streamed content.
Top geographies: Data about the regions where your audience is located.
Top subtitle/CC languages: The subtitle/closed captioning languages in which your videos are commonly accessed.
Exploring more with Advanced Mode
If you’ve been following along as we’ve gone over the primary metrics YouTube serves up to creators, you’ve probably noticed there is an option to “See More” under just about every section. Clicking from a specific metric will take you to the associated expanded data, or you can also access all of it from “Advanced Mode” in the top right corner of the Analytics page.
One of the most useful features of Advanced Mode is that it gets even more into the nitty gritty of demographics. You can see the makeup of people viewing your content in terms of cities, age, gender—all the way down to what operating system they’re watching on.
You’re also able to compare the data. For instance, if you want to look at the breakdown of what percentage of views are coming from viewers on iOS vs Android, while also seeing how that translates into watch time or average view duration, you can select the appropriate filters and have it all laid out for you.
Also read: Who was the first YouTuber?
What analytics should I track on YouTube?
Suppose you’re overwhelmed by the amount of data available. In that case, the good news is that you can get a lot out of just focusing on a smaller subset of analytics rather than keeping tabs on every single bit of information available to you. It’s good to understand what’s there, in case your needs shift over time and you find yourself needing to go a little deeper.
But for now, here are some of the most helpful metrics to watch beyond simple views, and why:
1. Watch time: If people spend a lot of time watching your videos, YouTube is more likely to recommend them to other viewers.
2. Audience retention: The average percentage viewed, view duration, and the graph showing at what specific points an individual video begins to lose viewers’ attention can help you identify areas where you can improve your content to better connect with viewers. These stats are also important because, as with watch time, they can influence YouTube’s algorithm.
3. Impressions click-through rate: A low click-through rate can signify a need to switch up your title and thumbnail, to better lure random viewers into clicking on your video when it’s suggested to them. You can also use the analytics funnel of how impressions lead to watch time (found under Reach in Video analytics and Content > All under Channel analytics) to break things down further.
4. Demographics: Understanding information about the audience you’re drawing can help when you’re choosing video topics, thinking about branching out and approaching potential sponsors to make a deal.
5. Subscribers: Presumably, you’re already paying attention to your overall subscriber growth, but you can also see whether individual videos are drawing in new subscribers, and how many. Moreover, tracking this info over time can allow you to step back and look at the bigger picture regarding which strategies are working for your channel and which maybe aren’t.
6. Engagement: Engaged viewers can be far more valuable than having a ton of viewers. Pay attention to how your videos are doing in terms of likes and comments.
7. When your viewers are on YouTube: Several factors could go into this—whether your audience is made up primarily of school-aged kids and teenagers, what country your content is popular in, etc. But understanding when your audience is generally hanging around on YouTube can help you set an uploading or live streaming schedule that works for you and maximizes visibility.
8. Traffic Sources: Where are your viewers finding your videos? Use this info to decide where to spend your energy in terms of promoting your work.
9. Search terms: An awareness of what people are typing into YouTube’s search before they find your video can help you refine your keywords, titles, and summaries for both current and future videos.
10. End screen element click rate: Your end screen directs viewers to your additional content, social media, and other important links of your choosing, but is it enticing viewers to click? If not, this metric will give you a heads-up that something needs to be changed.
YouTube analytics will be the most valuable to you if you make sure to check them regularly. Look for patterns, make note of when you’re trying different things (switching out your thumbnail format, altering your release schedule, etc), and keep looking beyond the basic view counts to understand why a particular piece of content is or isn’t working for you or resonating with your audience. There’s always something to learn from both your best-performing content and your worst, as long as you keep paying attention.